

In the previous post we discussed sending email alerts with alertmanager, in this post we’ll configure the Prometheus Blackbox Exporter.
You can find the repository on Github .
Setup
BlackBox exporter is a monitoring tool that allows querying of endpoints over HTTP, HTTPS, DNS, etc.
Here we are going to monitor http://prometheus.io and a few more sites which may not exist. We are going to look for HTTP status and TLS certificate expiration duration.
A 200 HTTP response indicates that the site is working fine. Check the Mozilla article for more on HTTP response codes.
HTTP response status codes - HTTP | MDN
First we need to modify docker-compose for the last time. Add Blackbox image.
  blackbox:
    image: prom/blackbox-exporter:latest
    # privileged: true
    restart: unless-stopped
    container_name: Blackbox
    volumes:
      - ./blackbox/blackbox.yml:/etc/blackbox_exporter/config.yml
    ports:
      - '9115:9115'
    networks:
- monitoringNow we’ll need to modify prometheus.yml config to add blackbox job to let Prometheus collect the metrics coming from the blackbox exporter. Also in the config we see that we are looking for status codes that are of 200 class.
 - job_name: 'blackbox'
    metrics_path: /probe
    params:
      module: [http_2xx]  # Look for a HTTP 200 response.
    static_configs:
      - targets:
        - http://prometheus.io    # Target to probe with http.
        - https://prometheus.io   # Target to probe with https.
        - http://example.com:8080 # Target to probe with http on port 8080. This is for getting site down alert
    relabel_configs:
      - source_labels: [__address__]
        target_label: __param_target
      - source_labels: [__param_target]
        target_label: instance
      - target_label: __address__
replacement: blackbox:9115 # The blackbox exporter's real hostname:port.Finally add the rules in the alert_rules.yml for the alertmanager to be able to send alerts when the condition meets.
As discussed earlier, the first rules here is for http status code. Here we’ll get alerts for whenever our site’s status is anything other than 200–399.
The second rule is to get alert for SSL/TLS certificate expiry duration so that we can update the certificate before it expires. Here I have set it to 60 days, meaning this alert will be activated once I have only 60 days of duration for my certificates.
Note: You can create or your own expressions or use various sites to get them. Example I have used the expressions from “https://samber.github.io/awesome-prometheus-alerts/ ”.
- name: HTTP_Status_Failure
  rules:
    - alert: BlackboxProbeHttpFailure
      expr: probe_http_status_code <= 199 OR probe_http_status_code >= 400
      for: 0m
      labels:
        severity: critical
      annotations:
        summary: Blackbox probe HTTP failure (instance {{ $labels.instance }})
        description: "HTTP status code is not 200-399\n  VALUE = {{ $value }}\n  LABELS = {{ $labels }}"
- name: SSL_Expiry
  rules:
    - alert: BlackboxSslCertificateWillExpireSoon
      expr: 0 <= round((last_over_time(probe_ssl_earliest_cert_expiry[10m]) - time()) / 86400, 0.1) < 60
      for: 0m
      labels:
        severity: warning
      annotations:
        summary: Blackbox SSL certificate will expire soon (instance {{ $labels.instance }})
description: "SSL certificate expires in less than 200 days\n VALUE = {{ $value }}\n LABELS = {{ $labels }}"Start the containers with “docker compose up -d”.
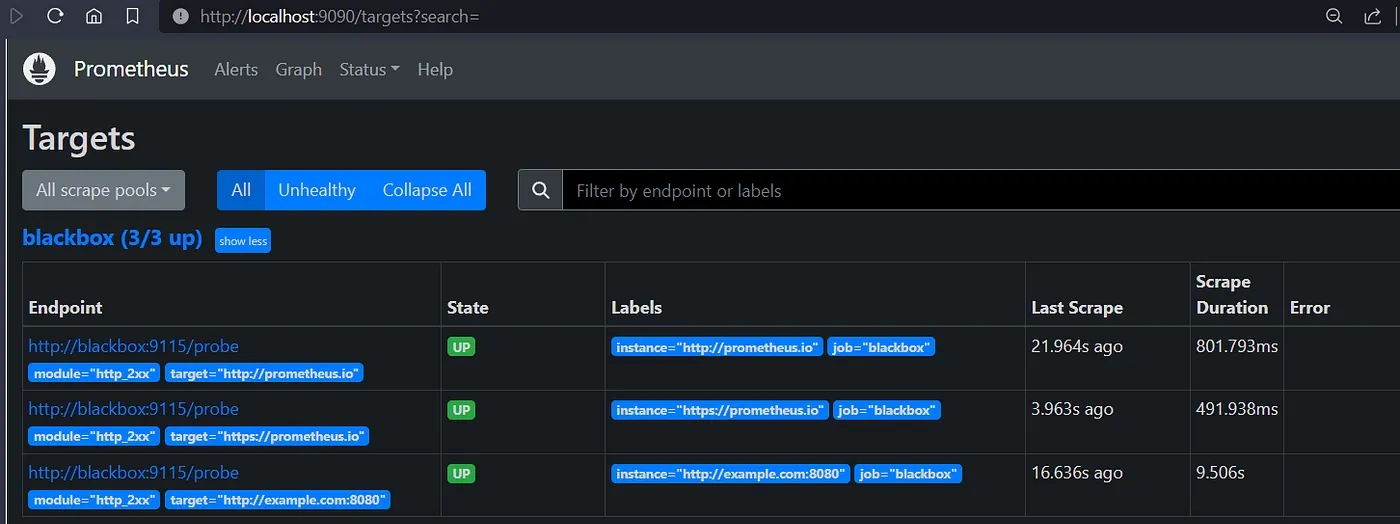
Launch Prometheus console and navigate to targets, with all other previous targets, we shall now see the blackbox section with the sites that we have configured.
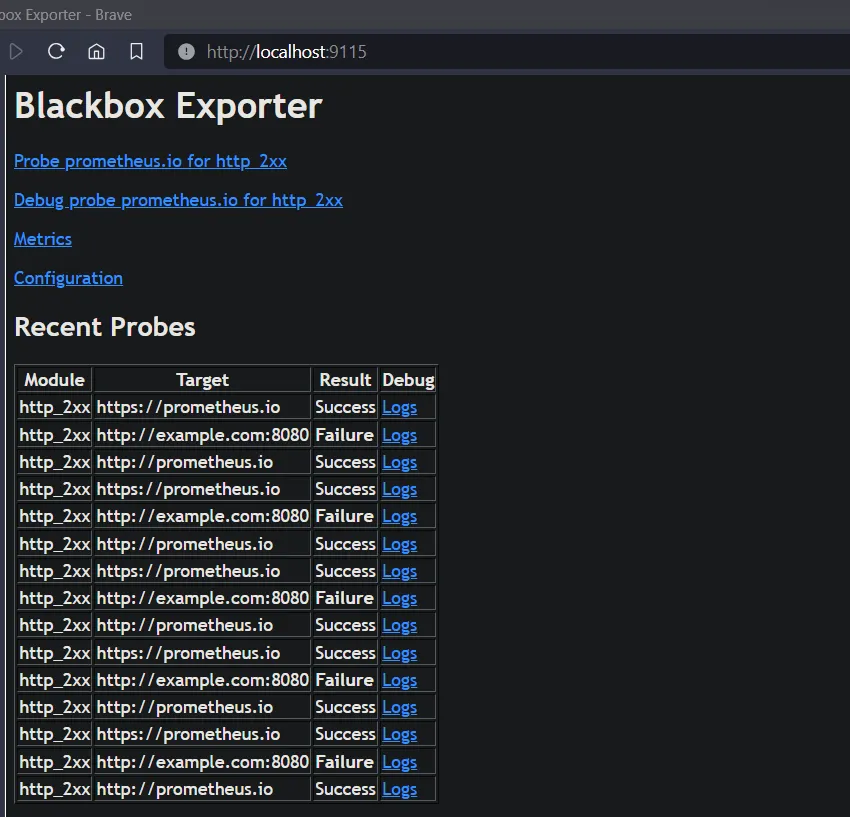
Browse ip:9115 to view the blackbox exporter data and its metrics.
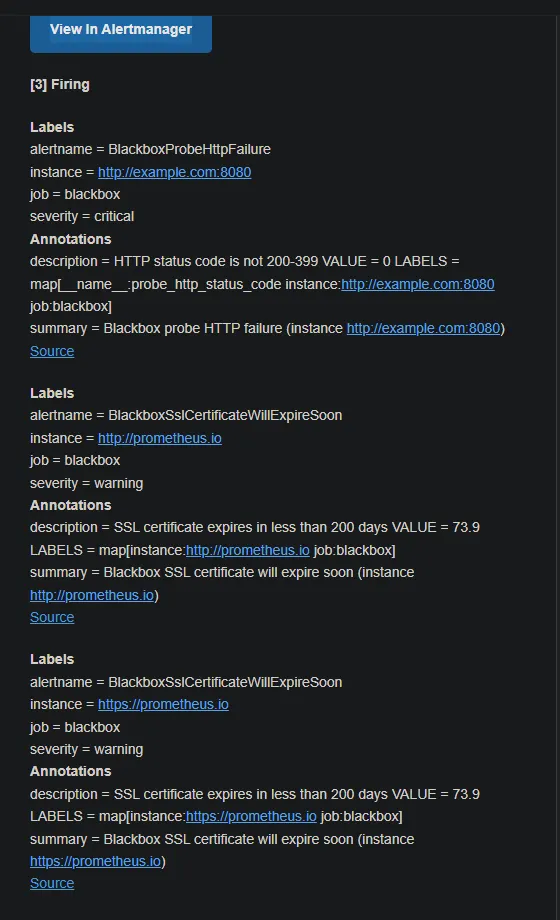
At this point we are already getting alerts. (I had the SSL expiry rule set to 365 days)
Finally its time to configure Grafana dashboard for viewing blackbox metrics. We can create dashboard ourself or import existing dashboard from Grafana dashboard website.
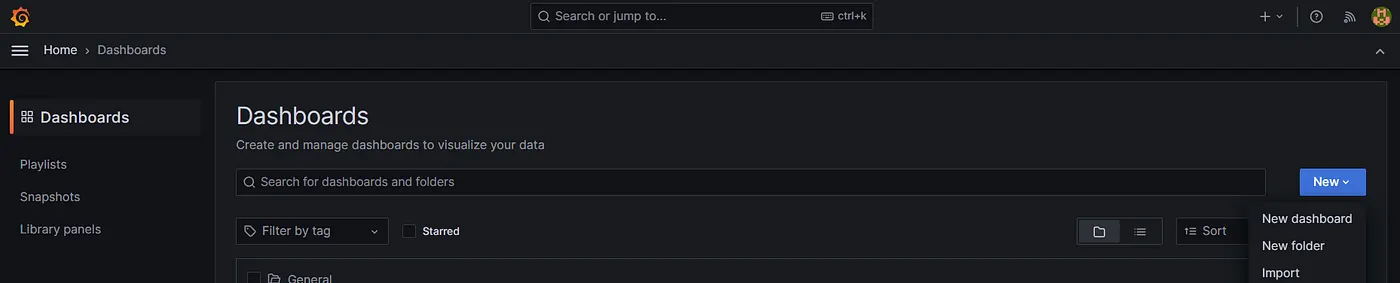
Here I m going to import it. Click on the Menu → dashboard → New Drop down → Import.
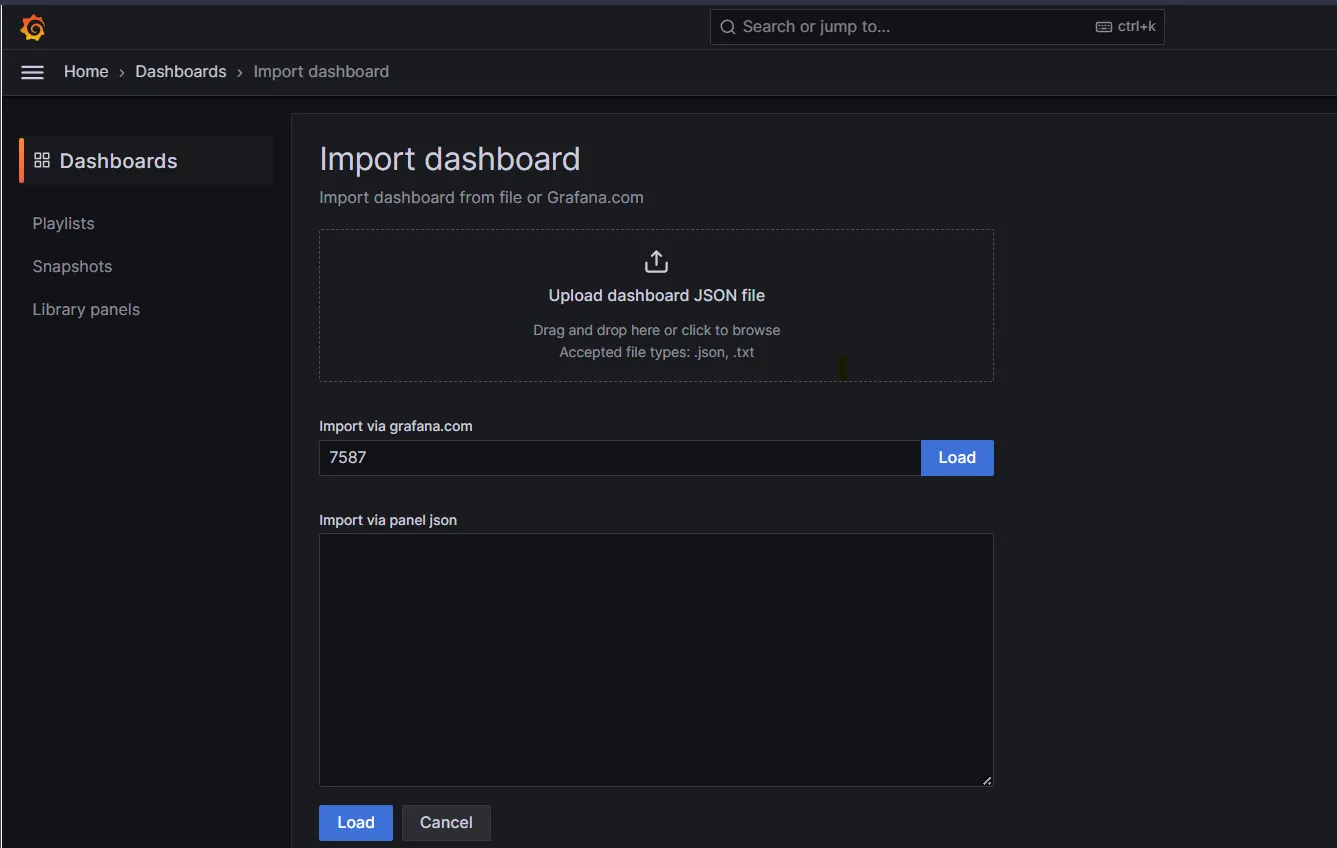
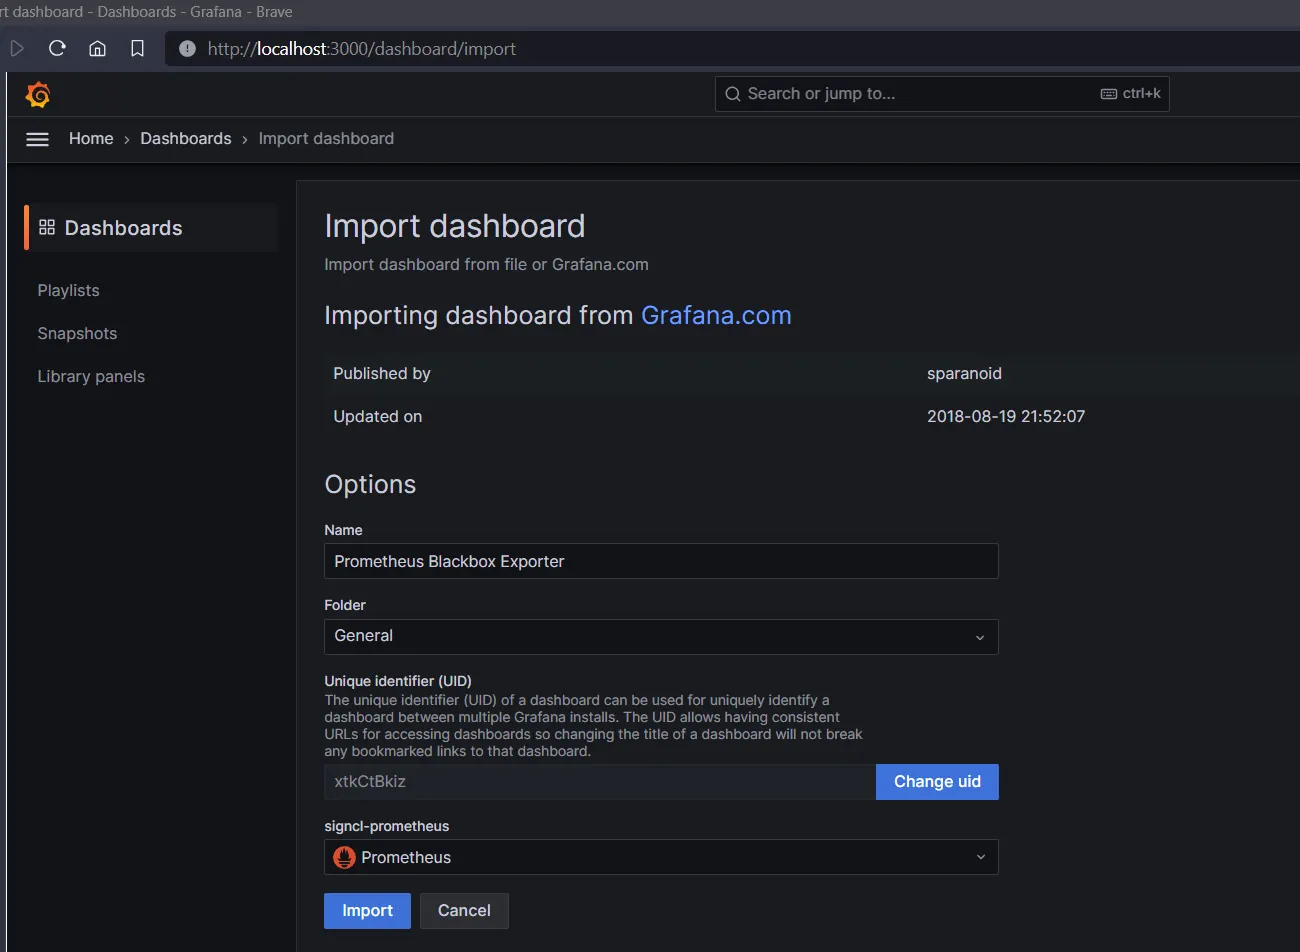
Now we can download a JSON or just provide the ID. I m going to use ID 7587. Click on Load button. On the next page select the datasource as Prometheus.
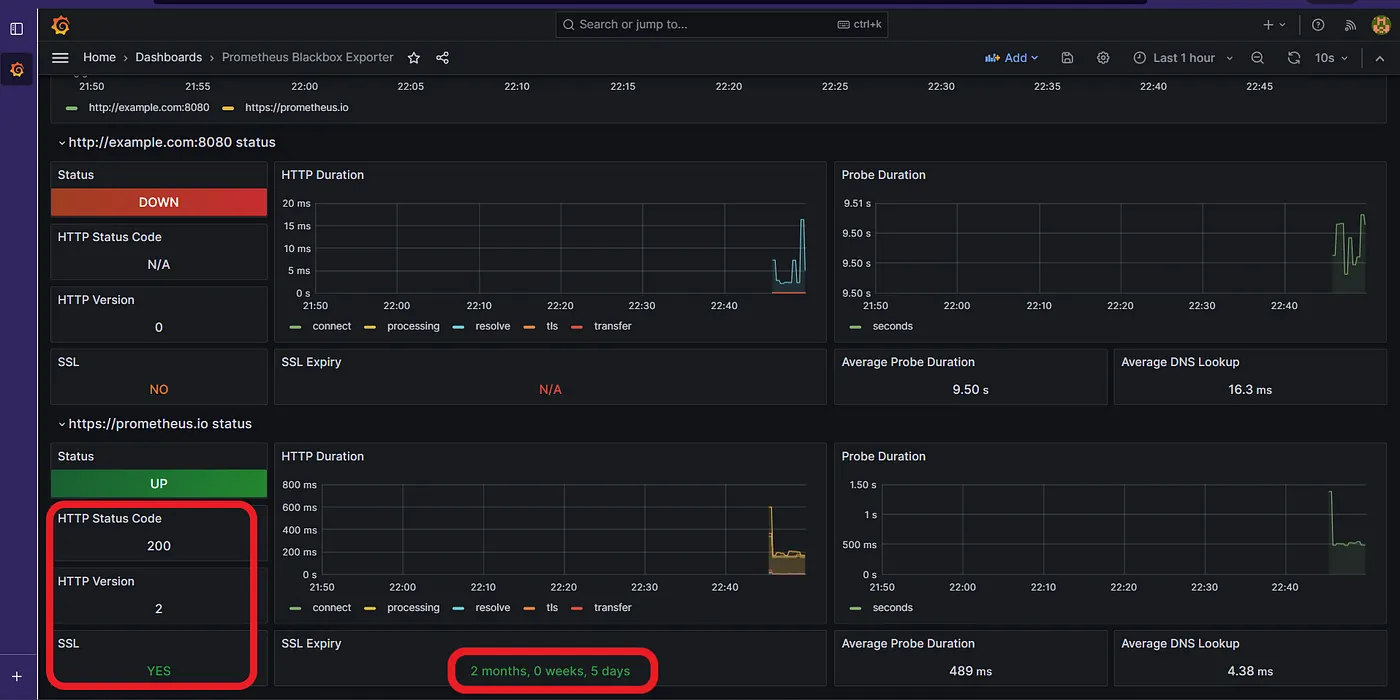
Well look what we have here. We get various information about the websites.
Hope you found this useful. Thanks for reading.
Send Email Alerts using Prometheus AlertManager
Visualize Your Website Metrics — Blackbox Exporter and Grafana