


Introduction:
Prometheus is a open-source platform for monitoring hardware and services. It collects metrics from the system of any other services that we configured.
It has a querying language called PromQL to analyse the metrics. We can also configure mail alerts for situation like hight resources usage, SSL expiration etc.
Although Prometheus has a bit of graphical representation for the collected metrics, Grafana, another oss offers rich visualisation of the data such as pie chart, bar chart etc. Grafana can show results form multiple platforms (called datasources) including prometheus.
In this article we are going to see how to setup monitoring of a linux machine.
I’m going to use Docker to setup this process, however you can install binaries as usual.
Prerequisites:
- Linux machine with docker and docker-compose.
Clone this github repository.
Lets understand the configuration:
We are launching 3 containers, so its better to use docker compose.
#docker-compose.yml
version: '3.8'
networks:
  monitoring:
    driver: bridge
volumes:
  prometheus_data: {}
  grafana_data: {}
services:
  node-exporter:
    image: prom/node-exporter:latest
    container_name: node-exporter
    restart: unless-stopped
    volumes:
      - /proc:/host/proc:ro
      - /sys:/host/sys:ro
      - /:/rootfs:ro
    command:
      - '--path.procfs=/host/proc'
      - '--path.rootfs=/rootfs'
      - '--path.sysfs=/host/sys'
      - '--collector.filesystem.mount-points-exclude=^/(sys|proc|dev|host|etc)($$|/)'
    ports:
      - 9100:9100
    networks:
      - monitoring
  prometheus:
    image: prom/prometheus:latest
    container_name: prometheus
    restart: unless-stopped
    volumes:
      - ./prometheus.yml:/etc/prometheus/prometheus.yml
      - prometheus_data:/prometheus
    command:
      - '--config.file=/etc/prometheus/prometheus.yml'
      - '--storage.tsdb.path=/prometheus'
      - '--web.console.libraries=/etc/prometheus/console_libraries'
      - '--web.console.templates=/etc/prometheus/consoles'
      - '--web.enable-lifecycle'
    ports:
      - 9090:9090
    networks:
      - monitoring
  grafana:
    image: grafana/grafana:latest
    container_name: grafana
    user: '0'
    ports:
      - 3000:3000
    restart: unless-stopped
    volumes:
      - ./grafana/provisioning:/etc/grafana/provisioning
      - /grafana_data:/var/lib/grafana
    networks:
- monitoringThe first service is node-exporter and and the commands are the locations from where node-exporter will collect system metrics. Node expoter is going to run on port 9100.
The 2nd service is Prometheus container with volume containing prometheus.yml the main configuration for Prometheus (we’ll see later in the article). Prometheus is set to run on 9090.
Finally the last container is Grafana. Here the first volume is an additional configuration for automatic configuration of Prometheus. If we skip this we can manually configure Prometheus data source and dashboard.
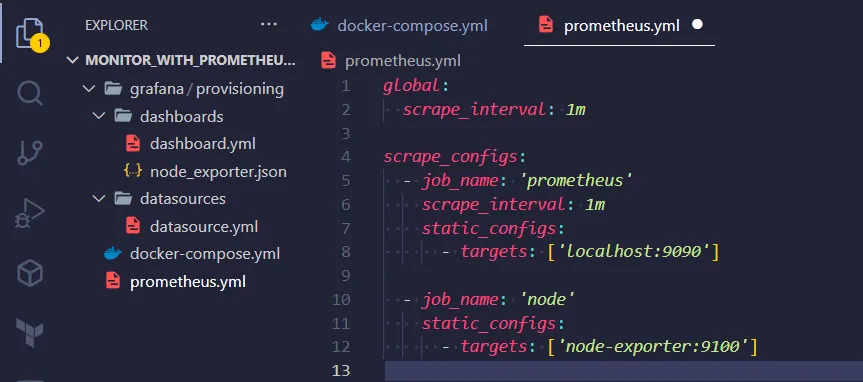
Create the prometheus.yml file with the below content:
#prometheus.yml
global:
  scrape_interval: 1m
scrape_configs:
  - job_name: 'prometheus'
    scrape_interval: 1m
    static_configs:
      - targets: ['localhost:9090']
  - job_name: 'node'
    static_configs:
- targets: ['node-exporter:9100']— targets: [‘localhost:9090’] — Here prometheus collects it’s own metrics. You can skip this.
— targets: [‘node-exporter:9100’] — Here prometheus collects the data provided by the node exporter. these are the metrics for the resource usage of machine.
Now to start the containers, first navigate the location where the compose file is present. We need to run the command:
$ docker compose up -dTo understand more about docker, checkout out these articles. Docker
Once the images are pulled and ran without any error, we can browse the particular applications.
Check the status of the containers with docker ps. If any container is exited or restarting continuously, see the logs to find out what’s wrong.
$ docker ps <or>
$ docker ps -a
CONTAINER ID   IMAGE                       COMMAND                  CREATED          STATUS          PORTS                                       NAMES
018a806beb2b   prom/prometheus:latest      "/bin/prometheus --c…"   24 minutes ago   Up 24 minutes   0.0.0.0:9090->9090/tcp, :::9090->9090/tcp   prometheus
213b22c60659   prom/node-exporter:latest   "/bin/node_exporter …"   24 minutes ago   Up 24 minutes   0.0.0.0:9100->9100/tcp, :::9100->9100/tcp   node-exporter
bc42690098fb   grafana/grafana:latest      "/run.sh"                24 minutes ago   Up 24 minutes   0.0.0.0:3000->3000/tcp, :::3000->3000/tcp   grafana
$ docker compose logs <conatainer name or id>
$ docker compose logs prmoetheusBrowse your IP:9090 for Prometheus , 9100 for Node exporter and 3000 for Grafana.
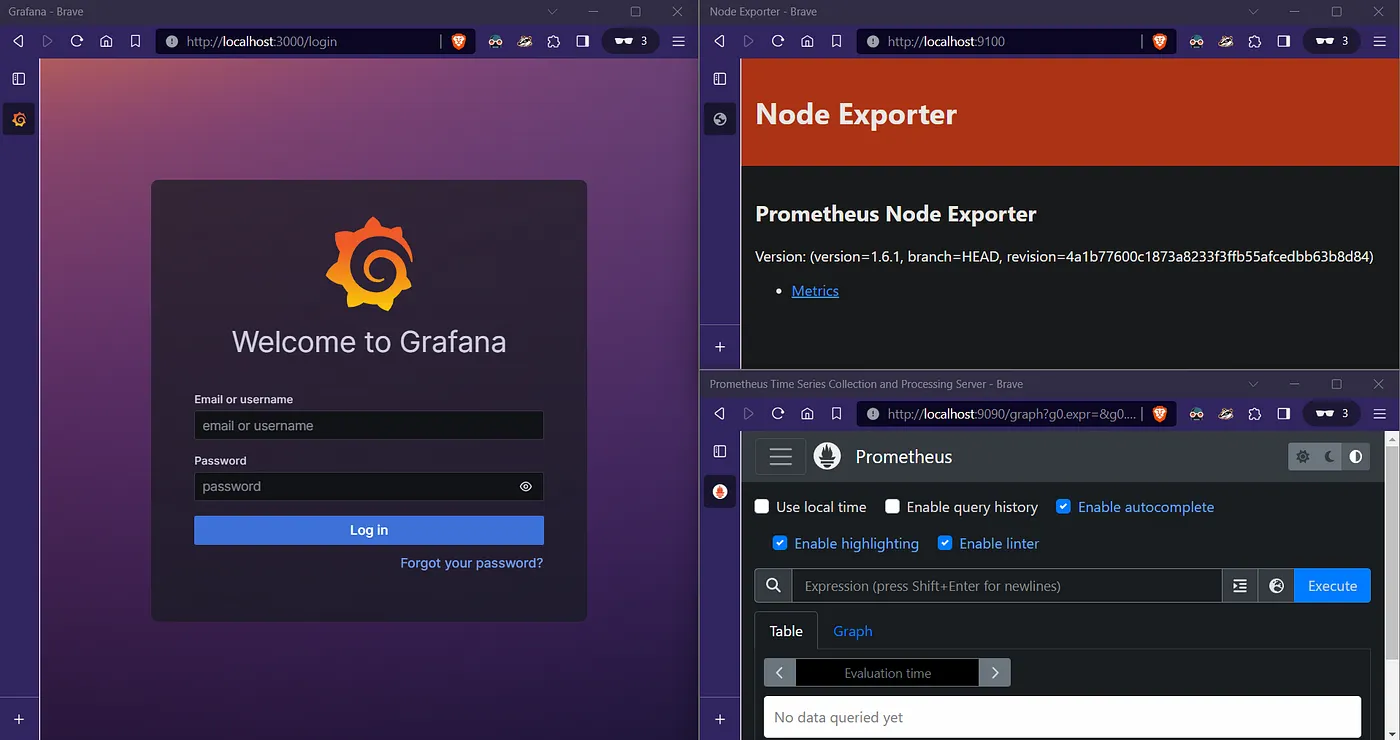
You can click on the metrics link on node exporter to see the data collected are displayed in raw format. Query data in prometheus and view as graph.
Now login to Grafana with admin/admin creds, reset password. Once completed. Now we can configure it to pull data from Prometheus by adding datasource. Add your Prometheus url and save it. Once this has been completed, you can query the same metrics inside grafana, create dashboard.
To create, dashboard, we can define everything manually or get predefined configuration from grafana (either by using ID or the json). View the list of dashboards available with the link below.
Dashboards | Grafana Labs | Browse a library of official and community-built dashboards
Now we have our monitoring setup ready. However, we can ease the setup of data source and dashboard configurations by proving configuration in our docker-compose.
To do so, we have to create the provisiong and datasources directories with the configurations shown in the screenshot.
[root@labputer Monitor_with_Prometheus]# tree
.
├── docker-compose.yml
├── grafana
│   └── provisioning
│       ├── dashboards
│       │   ├── dashboard.yml
│       │   └── node_exporter.json
│       └── datasources
│           └── datasource.yml
└── prometheus.yml
4 directories, 5 filesThe datasouces.yml configues the desired data-source (prometheus here) and the dashboard.yml is for creating dashboard automatically along with the provided json (obtained from grafna dashboards website https://grafana.com/grafana/dashboards/ , similar to how we need to do ourself with id or the json when doing manually).
# datasouces.yml
apiVersion: 1
datasources:
  - name: Prometheus # here we can configure differnt sources
    type: prometheus
    access: proxy
    orgId: 1
    url: http://prometheus:9090
    basicAuth: false
    isDefault: true
    editable: true
# -----------------------------
# dashboard.yml
apiVersion: 1
providers:
  - name: 'Prometheus'
    # orgId: 1
    # folder: 'General'
    type: file
    disableDeletion: false
    editable: true
    allowUiUpdates: true
    options:
      path: /etc/grafana/provisioning/dashboards
# node_exporter.json
skipped as the file is very long.
Downloaded from https://grafana.com/grafana/dashboards/.
You can configure as many dashbboards with json as per your requiremets.
I'm going to use only node exporter full.Now terminate the containers and we’ll run then again and this time with the first volume for the grafana config above in compose.
for your reference:
volumes:
- ./grafana/provisioning:/etc/grafana/provisioningUse docker compose down to terminate all and start them again with compose up.
$ docker compose down # terminates all containers
$ dockdr compose up -dNow opening Grafana, we can verify that Prometheus is already set as the default data source and our dashboard is also ready.
ip:3000/dashboards, ip:3000/datasources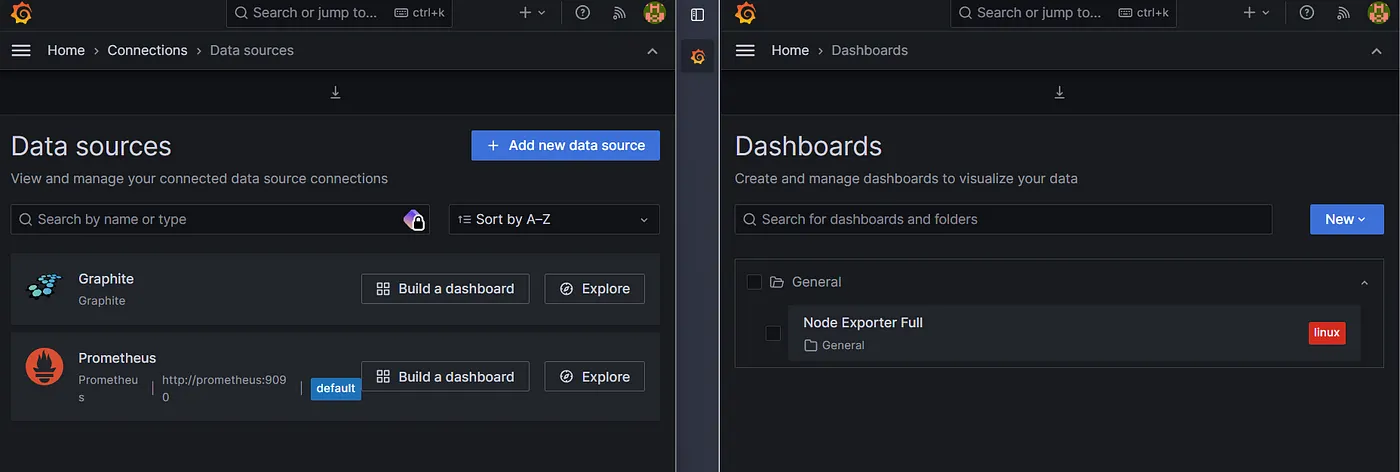
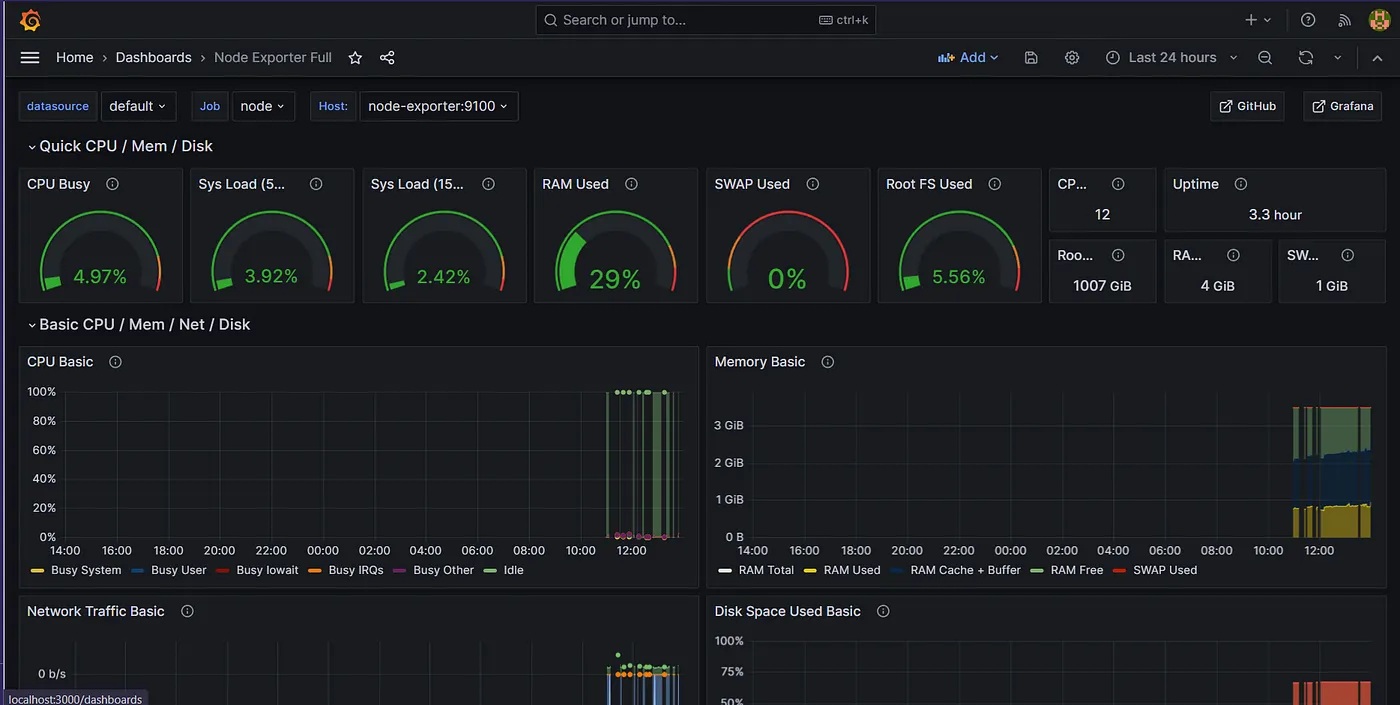
Alright, now we are all set. Browse the node exporter full to view all the metrics. Explore the settings to change visualization, query duration and etc.
Thanks for reading. In a future article, we will see how to configure alert manager and Blackbox exporter.
Further Reading:
Send Email Alerts using Prometheus AlertManager
Visualize Your Website Metrics — Blackbox Exporter and Grafana