Why this setup?
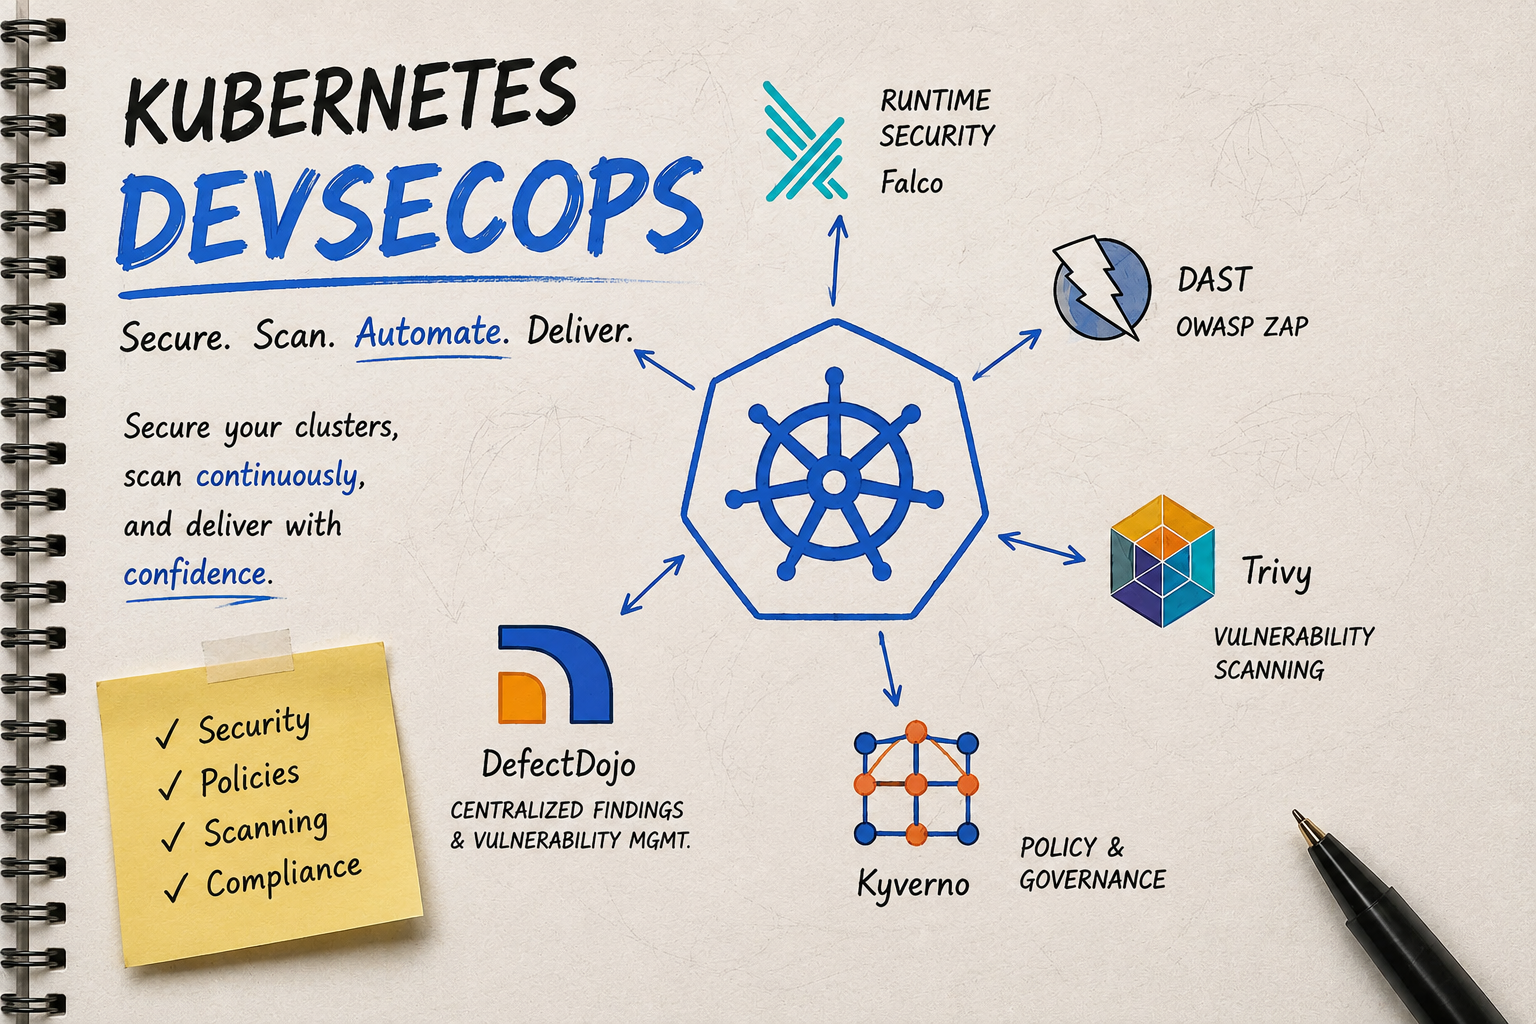
Security needs to cover more than just the source code. Each tool in this lab has a specific role, from finding issues early to enforcing policies and detecting problems at runtime.
This post builds on the otel labs infrastructure and implements security across two repositories:
- Application Repo (
otel-labs) — application security from source code through container images - Platform Repo (
otel-labs-platform) — infrastructure security, Kubernetes policy enforcement, runtime detection, and testing of the deployed application
The separation is intentional. The application repository owns the security of the application and the artifacts it produces, while the platform repository owns the security of the infrastructure and the workloads that are deployed and run. Although OWASP ZAP is an application-security tool, we keep its workflow in the platform repository because the scan runs against the deployed application, and this lets us use the github-actions[bot] commit condition from the GitOps deployment flow to trigger the scan at the right point.
Note: ZAP was originally an OWASP project and is now an independent open-source project supported by Checkmarx. This article still uses OWASP ZAP because the name remains widely recognized.
Table of Contents
- Part I: Application Security
- Part II: Platform Security
- Part III: General Concepts & End-to-End Flow
- Deployment & Setup
- Key Takeaways
- Troubleshooting
- Next Steps
- References
Part I: Application Security
The otel-labs repository contains the application code for the three services:
- Node.js frontend
- Python orders service
- Go inventory service
The application side of the project is about protecting the code and the artifacts it produces before they move into the platform.
We use four layers here:
Source repository
↓
Gitleaks
↓
Semgrep
↓
Trivy FS
↓
Build container images
↓
Trivy Image
↓
GHCR
1. Gitleaks: Secret Detection
The first check is for something that can cause an immediate problem if it gets committed: credentials and other secrets. We check both the current repository and Git history because deleting a secret from the latest version does not remove it from an older commit.
We use Gitleaks for both checks.
File: .github/workflows/gitleaks.yml
name: Gitleaks
on:
push:
branches: [main]
paths-ignore:
- '**/*.md'
- '.gitignore'
- 'LICENSE'
permissions:
contents: read
security-events: write
jobs:
gitleaks:
name: Secret Scan
runs-on: ubuntu-latest
steps:
- name: Checkout repository
uses: actions/checkout@v4
with:
fetch-depth: 0
- name: Run Gitleaks (git history)
uses: gitleaks/gitleaks-action@e0c47f4f8be36e29cdc102c57e68cb5cbf0e8d1e
env:
GITHUB_TOKEN: ${{ secrets.GITHUB_TOKEN }}
GITLEAKS_ENABLE_UPLOAD_ARTIFACT: true
GITLEAKS_ENABLE_SUMMARY: true
- name: Run Gitleaks (full filesystem)
if: always()
run: |
docker run --rm -v "$PWD:/path" ghcr.io/gitleaks/gitleaks:latest \
dir /path --report-format sarif \
--report-path /path/gitleaks-fs.sarif --exit-code 0
- name: Upload SARIF to GitHub Security
uses: github/codeql-action/upload-sarif@v4
with:
sarif_file: gitleaks-fs.sarif
category: gitleaks-fs
- name: Upload to DefectDojo
if: always()
run: |
curl -X POST \
"${{ secrets.DEFECTDOJO_URL }}/api/v2/reimport-scan/" \
-H "Authorization: Token ${{ secrets.DEFECTDOJO_API_KEY }}" \
-H "Accept: application/json" \
-F "scan_type=SARIF" \
-F "file=@gitleaks-fs.sarif" \
-F "product_type_name=SP Org" \
-F "product_name=Otel Labs" \
-F "engagement_name=App Sec Engagement" \
-F "test_title=Gitleaks"
The workflow therefore gives us two views:
- Git history — secrets committed in the past
- Filesystem — secrets present in the repository now
The findings are written as SARIF for GitHub Security and sent to DefectDojo. The filesystem scan uses exit-code: 0, so it reports findings without blocking the workflow.
2. Semgrep: SAST
The next check looks at our own source code. A lot of security problems can be found without running the application at all. This is the idea behind SAST (Static Application Security Testing).
Semgrep analyzes the Node.js, Python, and Go code for insecure patterns. In this project we use its automatic configuration and export the results as SARIF.
File: .github/workflows/semgrep.yml
name: Semgrep
on:
push:
branches: [main]
paths:
- 'node-frontend/**'
- 'python-orders/**'
- 'go-inventory/**'
permissions:
....
....
jobs:
semgrep:
name: SAST Scan
runs-on: ubuntu-latest
container:
image: semgrep/semgrep
steps:
.....
.....
- name: Run Semgrep
continue-on-error: true
run: |
semgrep scan --config auto --sarif --output semgrep.sarif .
- name: Upload SARIF to GitHub Security
if: always()
uses: github/codeql-action/upload-sarif@v4
with:
sarif_file: semgrep.sarif
- name: Upload to DefectDojo
if: always()
run: |
curl -X POST \
"${{ secrets.DEFECTDOJO_URL }}/api/v2/reimport-scan/" \
-H "Authorization: Token ${{ secrets.DEFECTDOJO_API_KEY }}" \
-H "Accept: application/json" \
-F "scan_type=SARIF" \
-F "file=@semgrep.sarif" \
-F "product_type_name=SP Org" \
-F "product_name=Otel Labs" \
-F "engagement_name=App Sec Engagement" \
-F "test_title=Semgrep"
The scan covers the application source itself. It is different from secret scanning: Gitleaks asks whether sensitive values have been exposed, while Semgrep looks for insecure coding patterns.
Dependabot: Automated Dependency Updates
While Trivy detects vulnerable dependencies, Dependabot automatically creates pull requests to update them.
Dependabot is GitHub's native SCA tool that monitors your dependency files and creates PRs when updates are available.
File: .github/dependabot.yml
version: 2
updates:
# Node.js/npm dependencies
- package-ecosystem: npm
directory: /node-frontend
schedule:
interval: weekly
open-pull-requests-limit: 10
# Python dependencies
- package-ecosystem: pip
directory: /python-orders
schedule:
interval: weekly
open-pull-requests-limit: 10
# Go dependencies
- package-ecosystem: gomod
directory: /go-inventory
....
....
# GitHub Actions
- package-ecosystem: github-actions
directory: /
....
....
How it works:
Dependabot scans package.json, requirements.txt, go.mod, and GitHub Actions workflows. When a newer version is available, it automatically creates a pull request.
Each PR triggers your existing security scanning workflows (Gitleaks, Semgrep, Trivy), so the updated dependencies are validated before merging.
Enable in your repository: - Settings → Code security and analysis → Dependabot alerts
Toggle on:
- ✅ Dependabot alerts
- ✅ Dependabot security updates
- ✅ Dependabot version updates
What Trivy does in this lab for SCA:
While Dependabot handles automatic updates, Trivy FS provides active vulnerability scanning:
- Trivy scans every commit for known CVEs in dependencies
- Reports HIGH/CRITICAL vulnerabilities immediately
- Does not automatically create PRs (just reports findings)
- Complements Dependabot by catching vulnerabilities before they're fixed
The two can work together:
Trivy FS
↓
Detects vulnerable dependencies
↓
Reports to GitHub Security + DefectDojo
↓
Dependabot
↓
Creates update PRs
↓
Merge and re-scan with Trivy
This gives you both visibility and automation for dependency management.
3. Trivy FS: Dependency / SCA Scanning
Our application also depends on packages we did not write ourselves. A vulnerability in an npm package, Python dependency, or Go module can therefore become a vulnerability in our application.
This is the area covered by SCA (Software Composition Analysis) or dependency scanning.
We use Trivy's filesystem scan to check the repository before the application is turned into its final container image.
Included in: .github/workflows/build-scan-push.yml — runs before the image build step so vulnerabilities in dependencies are caught before the final artifact is produced.
For this project, the relevant inputs include:
package.jsonfor the Node.js applicationrequirements.txtfor Pythongo.modfor Go- Dockerfile-related configuration
This gives us an early dependency/configuration check before we deal with the final container artifact.
4. Trivy Image: Container Scanning
The repository scan is not the same as scanning the image that will actually run. Once the containers are built, the final artifact contains the application plus its base image, OS packages, and installed application packages.
So we scan the images themselves with Trivy Image.
File: .github/workflows/build-scan-push.yml
name: Build, Scan and Push Images
on:
push:
....
....
jobs:
build-scan-push:
runs-on: ubuntu-latest
env:
GHCR_OWNER: ${{ github.repository_owner }}
TRIVY_CONFIG: .trivy/config.yaml
steps:
-....
....
- name: Scan node-frontend image
uses: aquasecurity/trivy-action@v0.36.0
with:
image-ref: ghcr.io/${{ env.GHCR_OWNER }}/node-frontend:latest
format: sarif
output: trivy-node-frontend.sarif
trivy-config: ${{ env.TRIVY_CONFIG }}
exit-code: 0
# ... repeat for python-orders, go-inventory, otel-collector
- name: Upload node-frontend SARIF
uses: github/codeql-action/upload-sarif@v4
with:
sarif_file: trivy-node-frontend.sarif
category: trivy-node-frontend-image
delete-old-findings: true
- name: Upload node-frontend to DefectDojo
if: always()
run: |
curl -X POST \
"${{ secrets.DEFECTDOJO_URL }}/api/v2/reimport-scan/" \
-H "Authorization: Token ${{ secrets.DEFECTDOJO_API_KEY }}" \
-H "Accept: application/json" \
-F "scan_type=SARIF" \
-F "file=@trivy-node-frontend.sarif" \
-F "product_type_name=SP Org" \
-F "product_name=Otel Labs" \
-F "engagement_name=App Sec Engagement" \
-F "test_title=Trivy Node Frontend Image"
- name: Push latest images
run: docker compose push
- name: Create GitOps commit
run: |
# Update platform repo with new image tags
# This triggers platform repo security scans
Our Trivy configuration focuses the SARIF output on HIGH and CRITICAL findings:
File: .trivy/config.yml
severity:
- HIGH
- CRITICAL
scanners:
- vuln
- misconfig
format: sarif
vulnerability:
ignore-unfixed: true
limit-severities-for-sarif: true
The images covered by the workflow are:
node-frontendpython-ordersgo-inventoryotel-collector
The results go to GitHub Security and DefectDojo, and the images are pushed to GHCR as part of the workflow.
At this point the application repository has completed its security checks and produces the container images consumed by the platform repository.
Part II: Platform Security
The platform repository is where the application moves into its Kubernetes environment. It contains the Terraform infrastructure, Kubernetes manifests, security policies, Falco configuration, and the workflow used to test the deployed application.
The platform-side flow is:
otel-labs-platform
↓
Gitleaks
↓
Trivy Config
↓
ArgoCD / Kubernetes
↓
Kyverno
↓
Falco
↓
OWASP ZAP
1. Gitleaks: Platform Repository
The same secret problem exists in the platform repository. Terraform files, Kubernetes manifests and GitOps configuration can contain sensitive values too, so the platform repo needs its own secret scan.
The implementation is the same idea as the application repository: scan the repository and its history, produce SARIF, and send the result to the security systems.
2. Trivy Config: Terraform and Kubernetes
Once the application reaches the platform repository, we are looking at a different class of problems.
Here the question is not whether a package has a CVE. It is whether the infrastructure or Kubernetes configuration is unsafe.
For example:
- an unencrypted EBS volume
- an overly open security group
- a container running with unsafe settings
- missing resource limits
This is where Trivy Config is useful.
File: .github/workflows/trivy.yml
name: Trivy Config Scan
on:
push:
branches: [main]
permissions:
contents: read
security-events: write
jobs:
trivy-k8s:
....
steps:
- ...
- name: Scan Kubernetes manifests
uses: aquasecurity/trivy-action@v0.36.0
with:
scan-type: config
scan-ref: ./k8s
trivy-config: .trivy/config.yaml
format: sarif
output: trivy-k8s.sarif
severity: HIGH,CRITICAL
exit-code: 0
- name: Upload Kubernetes SARIF to GitHub Security
uses: github/codeql-action/upload-sarif@v4
with:
sarif_file: trivy-k8s.sarif
category: trivy-k8s
- name: Upload to DefectDojo
if: always()
run: |
curl -X POST \
"${{ secrets.DEFECTDOJO_URL }}/api/v2/reimport-scan/" \
....
....
trivy-terraform:
runs-on: ubuntu-latest
steps:
- ....
- name: Scan Terraform
uses: aquasecurity/trivy-action@v0.36.0
with:
scan-type: config
scan-ref: ./terraform
trivy-config: .trivy/config.yaml
format: sarif
output: trivy-terraform.sarif
severity: HIGH,CRITICAL
exit-code: 0
- name: Upload Terraform SARIF to GitHub Security
....
....
- name: Upload to DefectDojo
if: always()
run: |
curl -X POST \
....
....
We therefore run two configuration scans:
Terraform
↓
Trivy Config
↓
Infrastructure findings
Kubernetes
↓
Trivy Config
↓
Workload/configuration findings
The scan can find configuration problems such as:
HIGH: EBS Volume Not Encrypted
HIGH: Pod Running as Root
MEDIUM: Missing Resource Limits
The important point is that this is a configuration check, not the same thing as scanning an application dependency or container image.
The Platforms
Before looking at the remaining platform controls, it helps to understand the three ideas behind them: admission control, runtime detection, and centralized findings management.
Runtime Security: Falco
Admission control is useful for controlling what enters the cluster, but it doesn't tell us what a workload actually does after it starts.
That is where runtime security comes in.
Falco watches activity on the running system and evaluates it against security rules.
The basic idea is:
Running workload
↓
Kernel activity
↓
Syscalls
↓
Falco
↓
Rules
↓
Security event
Syscalls
A process does not directly perform most privileged operations on the Linux system. It requests them through system calls (syscalls) exposed by the kernel.
Opening a file, creating a process, changing permissions, creating a network connection and many other operations eventually involve syscalls. That makes syscall activity useful for runtime security because it gives us a view of what processes are actually doing on the host.
For example, a command such as cat /etc/shadow results in file-access activity that Falco can observe and evaluate against its rules.
eBPF
eBPF (extended Berkeley Packet Filter) is a Linux technology that allows programs to run small pieces of code safely inside the kernel without modifying the kernel itself.
For security tools such as Falco, eBPF can be used to observe activity happening at the kernel level, including system calls and other events generated by processes.
In simple terms:
Application / Container
↓
System activity
↓
Linux Kernel
↓
eBPF
↓
Falco
↓
Falco Rules
↓
Security Event
The important connection is that eBPF is one way Falco can collect the low-level runtime events it needs for detection. Falco then evaluates those events against its rules and generates an alert when activity matches a rule.
Falco rules
Falco turns those runtime events into security detections using rules.
We worked through:
- built-in rules
- Kubernetes-specific rules
- custom rules
- rule matching
- runtime process activity such as
kubectl exec
For example, kubectl exec can result in a process being started inside a running container. That gives us a concrete runtime event to investigate with Falco.
We also used FalcoSidekick as the output/forwarding component for Falco events.
Try it manually
Falco can be tested in both the local environment and the Kubernetes environment.
For the Kubernetes deployment, use the Node frontend or any app pod as the test workload.
First, identify the Node frontend pod and the Kubernetes node it is running on:
kctl get pods -n otel-labs -o wide
The Node frontend was running on:
node-frontend-7589db9c99-nv2v7 1/1 Running ... ip-10-0-1-116.ap-south-1.compute.internal
Now identify the Falco pod running on the same node:
kctl get pods -n falco -o wide
The matching Falco pod was:
falco-z6vwk 2/2 Running ... ip-10-0-1-116.ap-south-1.compute.internal
Both pods are therefore running on:
ip-10-0-1-116.ap-south-1.compute.internal
This is important because Falco's syscall monitoring is node-local. The Falco instance running on the same node as the workload is the one that can observe its process activity.
Keep two terminals open.
In Terminal 1, watch the matching Falco pod:
kctl logs -f -n falco falco-z6vwk -c falco
In Terminal 2, execute whoami inside the Node frontend container:
kctl exec -n otel-labs node-frontend-7589db9c99-nv2v7 -- whoami
The command executes successfully, and Falco detects the process execution with the custom rule:
CUSTOM ALERT: whoami executed in container
The alert includes details such as the process, command, container name, image, namespace, and pod name.
This demonstrates Falco detecting process execution inside a real Kubernetes application container.
Note:
kubectl execworks even when the container uses a read-only root filesystem.readOnlyRootFilesystem: trueprevents filesystem writes; it does not prevent executing processes.
Local — Falco and Falcosidekick
The local setup provides a second demonstration using Falco and Falcosidekick.
Then try accessing a sensitive file:
sudo cat /etc/shadow
Falco's built-in rule for sensitive file access should detect the attempt and generate an event.
You can also create custom rules and have them run for example using whoami or ls etc for understanding it before implementing in k8s.
~$ cat /etc/falco/falco_rules.local.yaml
# Your custom rules!
- rule: Falco Lab Whoami
desc: Detect whoami execution
condition: spawned_process and proc.name = whoami
output: "FALCO LAB: whoami executed | user=%user.name command=%proc.cmdline"
priority: EMERGENCY
tags: [falco_lab, identity]
- rule: Falco Lab LS
desc: Detect ls execution
condition: spawned_process and proc.name = ls
output: "FALCO LAB: ls executed | user=%user.name command=%proc.cmdline"
priority: ALERT
tags: [falco_lab, filesystem]
- rule: Falco Lab ID
desc: Detect id execution
condition: spawned_process and proc.name = id
output: "FALCO LAB: id executed | user=%user.name command=%proc.cmdline"
priority: ERROR
tags: [falco_lab, identity]
- rule: Falco Lab Uname
desc: Detect uname execution
condition: spawned_process and proc.name = uname
output: "FALCO LAB: uname executed | user=%user.name command=%proc.cmdline"
priority: WARNING
tags: [falco_lab, system]
The resulting events can be viewed through the Falcosidekick UI.
There is an important catch in the Kubernetes setup, though: the OTel Labs deployments run with security restrictions such as non-root execution and read-only filesystems. Therefore, attempting to access /etc/shadow from those containers may fail because the process does not have permission to read the file in the first place.
That is actually a useful point. Runtime security is one layer, but we can also prevent this kind of activity from being possible in the first place.
That brings us to Kubernetes admission control.
Kubernetes Admission Control: Kyverno
Falco watches what happens after a workload is running. But what if we could stop an insecure workload from entering the cluster in the first place?
That is where Kubernetes admission control comes in.
When the Kubernetes API server receives a request to create or modify a resource, admission controllers can inspect that request before Kubernetes accepts it.
kubectl apply
↓
Kubernetes API Server
↓
Admission
↓
Admission Controller
↓
Allow / Reject / Modify
Kyverno is a Kubernetes-native policy engine that can be used to validate, mutate, generate, and verify resources as part of this process.
What can Kyverno do?
Kyverno policies can be used for several different jobs:
- Validate — check whether a resource follows a rule
- Mutate — modify a resource to bring it into the desired state
- Generate — create additional Kubernetes resources based on a policy
- Verify images — verify image signatures and attestations
For validation policies, Kyverno can either report a violation or prevent the resource from being admitted.
Audit vs Enforce
For a validation rule, Kyverno provides two failure actions:
Audit
↓
Violation is reported
↓
Resource is still allowed
Enforce
↓
Violation is detected
↓
Resource is rejected
The policy can therefore start in Audit mode while we understand its impact and later move to Enforce when we are ready to make the rule mandatory.
The current syntax is:
spec:
background: true
validationFailureAction: Enforce
Policy as code
The important part is that these security requirements can be written as Kubernetes policies instead of being maintained as documentation that developers are expected to follow manually.
The policies can live in Git and be managed through the same GitOps process as the rest of the platform:
Git
↓
Kyverno Policy
↓
ArgoCD
↓
Kubernetes
↓
Kyverno
↓
Admission decision
This also means policy changes can go through version control, review, and the same deployment process as other platform changes.
Policy exceptions
Enforcing a policy across an entire cluster can sometimes affect workloads that have a legitimate reason to be different.
Instead of weakening the policy globally, Kyverno supports PolicyExceptions that can be scoped to specific resources and specific policy rules.
For example:
General policy
↓
Applies to workloads
↓
Specific legitimate exception
↓
PolicyException
↓
Only that resource/rule is excluded
The idea is to keep the main policy strong while making exceptions explicit and limited.
What we will enforce in this lab
Now that the admission-control concepts are clear, we can apply them to our EKS environment.
In this lab, we will use Kyverno to enforce rules such as:
- images must have explicit tags
:latestis not allowed- CPU and memory requests are required
- CPU and memory limits are required
- images must come from trusted registries
We will use Enforce for these validation policies, so workloads that violate the rules are rejected during admission.
We will also use a scoped PolicyException where a legitimate platform component, such as Traefik, needs an exception from one of the general policies.
Policy exceptions
Strict policies can also affect legitimate platform components.
For example, our Traefik deployment does not satisfy every generic policy requirement, so instead of turning the policy off globally, we use a scoped PolicyException.
That is an important Kubernetes policy concept:
Make the exception explicit and narrow rather than weakening the policy for everything.
Try it manually
Now we can see admission control in action.
Try creating a pod using the latest tag:
kubectl run test-pod \
--image nginx:latest \
-n otel-labs
With our policy enabled, the request is rejected because :latest is not allowed.
A compliant workload with an explicitly tagged image and the required resources can be admitted.
There's also a test workload under archive/falco-trigger.yml. You can use it to test the policies because its image comes from the trusted registry already allowed by our policy.
First apply the workload by commenting anything that violates policy like requests and limits or namespace. You would see that it would fail with violations shows, if you uncomment them and try again, it is compliant and would work just fine.
This gives us two different security layers:
Kyverno
↓
Controls what is allowed into the cluster
↓
Running workload
↓
Falco
↓
Watches what happens at runtime
Kyverno and Falco therefore solve different problems:
- Kyverno prevents or restricts workloads at admission time.
- Falco detects suspicious activity while workloads are running.
Centralized Findings: DefectDojo
The scanners all answer different security questions, and each one produces its own results.
If we leave them separate, we have to check Gitleaks, Semgrep, Trivy and ZAP individually to understand what is happening across the project.
DefectDojo gives us one place to collect and manage those findings.
It is not another scanner. The scanners do the actual detection; DefectDojo receives, organizes and tracks their results.
How DefectDojo setup is organized
In the DefectDojo UI, the hierarchy is:
Organization → Asset → Engagement → Test → Findings
For this project:
- Organization:
SP Org - Asset:
Otel Labs - Engagements:
App Sec EngagementPlatform Sec Engagement
- Tests: individual scanner results within each Engagement
- Findings: security issues reported by those Tests
For example, the application-security side contains Tests for Gitleaks, Semgrep, Trivy and OWASP ZAP, while the platform-security side contains Tests for Gitleaks, Trivy Kubernetes and Trivy Terraform.
Each Test represents a particular security scan within an Engagement, and the findings produced by that scan are associated with that Test.
UI vs API
When we work in the DefectDojo UI, we use the hierarchy above.
When we automate the same process from GitHub Actions, the API uses different field names:
product_type_name = SP Org
product_name = Otel Labs
engagement_name = App Sec Engagement
test_title = Gitleaks
scan_type = SARIF
file = scanner-result.sarif
The API terminology does not map one-to-one to the labels we see in the current UI, so it is useful to keep the two views separate.
Reimporting scan results
Our workflows use the reimport-scan API so that new results from the same scanner can be imported back into the corresponding DefectDojo Test.
This keeps the scanner results associated with the same Test over time instead of creating an unrelated Test for every workflow run.
Before automating this, you can understand the structure directly in the UI by going through:
SP Org → Otel Labs → App Sec Engagement → Test → Findings
The platform scans follow the same structure under Platform Sec Engagement.
Automating DefectDojo from GitHub Actions
Once the DefectDojo structure makes sense, the GitHub Actions workflow can automate the import.
For example, our ZAP workflow sends its report to the DefectDojo reimport-scan API:
curl -X POST \
"${{ secrets.DEFECTDOJO_URL }}/api/v2/reimport-scan/" \
-H "Authorization: Token ${{ secrets.DEFECTDOJO_API_KEY }}" \
-H "Accept: application/json" \
-F "scan_type=ZAP Scan" \
-F "file=@report_xml.xml" \
-F "auto_create_context=true" \
-F "product_type_name=$DD_PRODUCT_TYPE" \
-F "product_name=$DD_PRODUCT" \
-F "engagement_name=$DD_ENGAGEMENT" \
-F "test_title=OWASP ZAP DAST" \
-F "close_old_findings=true" \
-F "do_not_reactivate=false" \
-F "environment=$DD_ENVIRONMENT" \
-F "build_id=$DD_BUILD_ID" \
-F "branch_tag=$DD_BRANCH" \
-F "commit_hash=$DD_COMMIT" \
-F "tags=github-actions,zap,dast,$DD_BRANCH"
The request handles several things in one call: it authenticates via the API token secret, identifies where to store the result using product_type_name, product_name, engagement_name, and test_title, uploads the actual ZAP XML report, passes build metadata (environment, branch, commit, build ID) for traceability, tags the import for easy filtering, and uses auto_create_context=true so DefectDojo creates the required hierarchy automatically on first run.
Closing and reactivating findings
The reimport also controls what happens to findings from earlier scans.
-F "close_old_findings=true"
-F "do_not_reactivate=false"
close_old_findings=true tells DefectDojo to close old findings that are no longer present in the newly imported scan.
do_not_reactivate=false allows a previously closed finding to become active again if a later scan reports it.
Note: We currently use
close_old_findings=truewith DefectDojo reimport. This can be too aggressive in our setup, causing many previous findings to be closed when they are not present in the latest scan result, even though their absence does not necessarily mean they have been fixed. This is a known issue we are still investigating and tuning. ◉ DefectDojo issue #14205.
GitHub Security and Workflow Artifacts
DefectDojo is not the only place where we keep the scanner results.
For scanners that produce SARIF output, we also upload the results to the GitHub Security tab.
This gives us two different views:
Scanner
↓
SARIF
├──→ GitHub Security
│
└──→ DefectDojo
GitHub Security is useful for seeing security findings directly alongside the repository and its pull requests, while DefectDojo gives us the centralized view across the different scanners and engagements.
Uploading SARIF to GitHub Security
For example, after Gitleaks, Semgrep or Trivy produces a SARIF file, we use GitHub's SARIF upload action:
- name: Upload SARIF to GitHub Security
uses: github/codeql-action/upload-sarif@v4
with:
sarif_file: semgrep.sarif
The important part is that the scanner produces the SARIF file first.
GitHub then consumes that file and displays the findings under the repository's security features.
We also use categories for scanners where multiple SARIF results are uploaded:
- name: Upload Trivy SARIF
uses: github/codeql-action/upload-sarif@v4
with:
sarif_file: trivy-node-frontend.sarif
category: trivy-node-frontend-image
The category helps distinguish results from different scans.
Workflow artifacts
SARIF is useful for GitHub Security, but sometimes we also want to keep the actual report produced by a workflow.
For example, ZAP produces an XML report that we send to DefectDojo. We can also upload that report as a GitHub Actions artifact.
The basic pattern is:
- name: Upload ZAP report
uses: actions/upload-artifact@v4
with:
name: zap-dast-report
path: report_xml.xml
This gives us three different places for the same security workflow:
Scanner
↓
Scan report
├──→ GitHub Security
│ SARIF
│
├──→ GitHub Actions Artifact
│ Raw report
│
└──→ DefectDojo
Findings
Each serves a different purpose:
- GitHub Security — view security findings alongside the repository
- GitHub Actions artifact — retain the raw scan report from that workflow run
- DefectDojo — centrally organize and track findings across scanners and engagements
This gives the project both repository-level visibility and a centralized security view without making DefectDojo responsible for generating the findings itself.
Platform Implementation Continued
Kyverno is installed during cluster bootstrap.
File: terraform/bootstrap.sh
helm upgrade --install kyverno \
kyverno/kyverno \
--namespace kyverno \
--create-namespace \
--timeout 8m \
--set features.policyExceptions.enabled=true \
--set features.policyExceptions.namespace=argocd
The last two options enable Kyverno PolicyException support and tell Kyverno which namespace to use for those exception resources.
--set features.policyExceptions.enabled=true
--set features.policyExceptions.namespace=argocd
The argocd namespace here is our choice. Kyverno does not require PolicyExceptions to be stored there. We chose argocd because the policies and their exceptions are managed through our GitOps setup. The important part is that the namespace configured here must match the namespace where you create the PolicyException resources.
In this lab, the policies and policyexceptions are stored under:
k8s/kyverno/policies/
We have several policies in the repository, but rather than showing every one here, let's look at one example and then one exception. The rest are available in the repository.
Image tag security
One of our policies makes sure container images use an explicit tag and prevents the use of :latest:
apiVersion: kyverno.io/v1
kind: ClusterPolicy
metadata:
name: image-tag-security
spec:
validationFailureAction: Enforce
rules:
- name: require-image-tag
match:
any:
- resources:
kinds: [Pod]
validate:
message: "Container images must use an explicit image tag."
pattern:
spec:
containers:
- image: "*:*"
- name: disallow-latest-tag
match:
any:
- resources:
kinds: [Pod]
validate:
message: "The latest image tag is not allowed."
pattern:
spec:
containers:
- image: "!*:latest"
This is a ClusterPolicy, so it can apply across the cluster.
The two rules handle related but separate checks:
require-image-tagmakes sure an image has an explicit tag.disallow-latest-tagspecifically rejects the:latesttag.
Because the policy uses Enforce, a Pod that violates either rule is rejected during admission.
We also have policies for resource requests and limits and for restricting images to trusted registries. You can see the complete set of policies used in this lab in the repository.
Policy exception
Policies are intentionally strict, but sometimes a platform component has a legitimate reason not to satisfy a general rule.
In our case, Traefik needs exceptions for some of the policies:
apiVersion: kyverno.io/v2
kind: PolicyException
metadata:
name: traefik-resource-exception
namespace: argocd
spec:
exceptions:
- policyName: resource-security
ruleNames:
- require-resource-requests
- require-resource-limits
- policyName: trusted-image-registries
ruleNames:
- validate-image-registry
match:
any:
- resources:
kinds: [Deployment, Pod]
namespaces: [traefik]
names: [traefik, traefik-*]
This exception is deliberately narrow. It does not disable the policies globally — the specified rules are excluded only for the matching Traefik Deployment and Pods in the traefik namespace.
Notice that the PolicyException itself is stored in the argocd namespace (where Kyverno looks for exceptions), while the workload being excepted is in the traefik namespace. These are two different things:
namespace: argocd— where thePolicyExceptionresource is stored.namespaces: [traefik]— which workloads the exception applies to.
Deployment through ArgoCD
The policies are stored in Git and deployed through ArgoCD.
File: k8s/argo-apps/kyverno-policy.yml
apiVersion: argoproj.io/v1alpha1
kind: Application
metadata:
name: kyverno-policies
namespace: argocd
spec:
project: default
source:
repoURL: https://github.com/sagarkpanda/otel-labs-platform
path: k8s/kyverno
destination:
namespace: kyverno
syncPolicy:
automated:
prune: true
selfHeal: true
This gives us the full flow:
Policy in Git
↓
ArgoCD
↓
Kyverno
↓
Admission webhook
↓
Workload allowed or rejected
4. Falco Implementation
Falco is installed during platform bootstrap alongside the other cluster components.
File: terraform/bootstrap.sh
helm upgrade --install falco \
falcosecurity/falco \
--namespace falco \
--create-namespace \
--timeout 8m \
--set tty=true \
--set falcosidekick.enabled=true \
-f "$REPO_ROOT/falco/custom-rules.yml"
The project also contains the custom Falco rules used by the installation.
The runtime layer therefore sits after admission:
Kubernetes admission
↓
Kyverno
↓
Workload starts
↓
Falco
↓
Runtime behavior detection
Falco covers runtime activity such as:
- unauthorized container escapes
- privilege escalation attempts
- unexpected network connections
- filesystem modifications
- suspicious process execution
The important thing is that these are runtime observations. The workload has already passed the Kubernetes admission stage.
5. OWASP ZAP Implementation
The final application-security check happens against the deployed application itself.
File: .github/workflows/zap.yml
name: OWASP ZAP DAST
on:
push:
branches: [main]
env:
DAST_TARGET_URL: http://otel.sagarpanda.com
jobs:
zap:
name: ZAP Full Scan
if: github.event.head_commit.committer.username == 'github-actions[bot]'
runs-on: ubuntu-latest
steps:
- name: Check application availability
id: check_url
run: |
if curl --fail --silent --max-time 30 \
"${DAST_TARGET_URL}" > /dev/null; then
echo "reachable=true" >> "$GITHUB_OUTPUT"
else
echo "reachable=false" >> "$GITHUB_OUTPUT"
fi
- name: Run OWASP ZAP Full Scan
if: steps.check_url.outputs.reachable == 'true'
uses: zaproxy/action-full-scan@v0.13.0
with:
target: ${{ env.DAST_TARGET_URL }}
rules_file_name: '.zap/rules.tsv'
cmd_options: '-I -x report_xml.xml'
artifact_name: 'zap-dast-report'
fail_action: false
- name: Upload ZAP Results to DefectDojo
if: steps.check_url.outputs.reachable == 'true'
run: |
curl -X POST \
"${{ secrets.DEFECTDOJO_URL }}/api/v2/reimport-scan/" \
-F "scan_type=ZAP Scan" \
-F "file=@report_xml.xml" \
-F "product_type_name=SP Org" \
-F "product_name=Otel Labs" \
-F "engagement_name=App Sec Engagement" \
-F "test_title=OWASP ZAP DAST"
The workflow first checks whether the application is reachable. If it is, ZAP runs against the live application.
It is triggered by the github-actions[bot] commit used in the GitOps promotion flow.
The ZAP action can also open a GitHub issue automatically by setting issue: true. An HTML report is also generated alongside the XML and JSON for easier reading.
The scan does not block the workflow because fail_action is set to false; the result is instead reported and sent to DefectDojo.
End-to-End Flow
Now all of the individual pieces fit together:
Developer
↓
otel-labs
│
├── Gitleaks
├── Semgrep
├── Trivy FS
│
↓
Build container images
↓
Trivy Image
↓
GHCR
↓
GitOps update
↓
otel-labs-platform
│
├── Gitleaks
├── Trivy Terraform
└── Trivy Kubernetes
↓
ArgoCD
↓
Kubernetes
↓
Kyverno
│
├── allow
└── reject
↓
Running workload
↓
Falco
↓
Runtime detection
↓
OWASP ZAP
↓
DefectDojo
The important part is that these tools are not doing the same job.
Gitleaks → secrets
Semgrep → source-code security
Trivy FS → dependencies
Trivy Image → container artifacts
Trivy Config → Terraform and Kubernetes configuration
Kyverno → admission-time enforcement
Falco → runtime behavior
OWASP ZAP → live application testing
DefectDojo → centralized findings
Deployment & Setup
Prerequisites
- EKS cluster deployed from the OTel on EKS project, steps below
Step 1: Bootstrap the cluster
Apply the Terraform configuration to create the EKS cluster. During cluster creation, the bootstrap script installs Argo CD, Kyverno and Falco.
The relevant Helm repositories and installations are:
helm repo add argo https://argoproj.github.io/argo-helm
helm repo add kyverno https://kyverno.github.io/kyverno/
helm repo add falcosecurity https://falcosecurity.github.io/charts
helm upgrade --install kyverno kyverno/kyverno \
--namespace kyverno \
--create-namespace \
--timeout 8m \
--set features.policyExceptions.enabled=true \
--set features.policyExceptions.namespace=argocd
helm upgrade --install argocd argo/argo-cd \
-n argocd \
--timeout 8m
helm upgrade --install falco falcosecurity/falco \
--namespace falco \
--create-namespace \
--timeout 8m \
--set falcosidekick.enabled=true \
-f falco/custom-rules.yml
Once the cluster is ready, you can create the otel-labs application as usual by applying the Argo CD root application. If you want to access the Argo CD UI, you can also create the Argo CD ingress.
For the complete application deployment steps, refer to the OTel on EKS guide.
FalcoSidekick
FalcoSidekick is enabled in the Falco installation above:
--set falcosidekick.enabled=true
This enables the communication path between Falco and FalcoSidekick, allowing Falco events to be forwarded to the destinations configured through Sidekick.
If you want to access the FalcoSidekick UI, enable the UI as part of the Helm installation and create an ingress for it.
You can also configure FalcoSidekick to forward Falco alerts to the OTel platform by updating its ConfigMap.
If you only want to verify that Falco is detecting events and do not need FalcoSidekick or its UI, you can omit --set falcosidekick.enabled=true. Falco can run without Sidekick; Sidekick is used when you want to forward and manage the Falco events through additional outputs.
Step 2: Configure GitHub secrets
Set the required DefectDojo secrets in both repositories:
Settings → Secrets and variables → Actions
DEFECTDOJO_URL=https://defectdojo.example.com
DEFECTDOJO_API_KEY=your-api-token
You can clone the ◉ django-DefectDojo repository and run it with Docker Compose to get DefectDojo running locally.
If you run DefectDojo this way, you can use a Cloudflare Tunnel to expose it with a URL that can be reached by your GitHub Actions workflows.
cloudflared tunnel --url http://localhost:8080
Once you have logged in to DefectDojo, click on your user profile → API V2 Key to get the API key used by the workflows.
After starting DefectDojo with Docker Compose, you can create a user from the uwsgi container:
docker compose exec uwsgi python manage.py createsuperuser
Follow the prompts to set the username, email address and password.
Step 3: Verify workflows
otel-labs
Actions → Gitleaks
Actions → Semgrep
Actions → Build, Scan, Push
otel-labs-platform
Actions → Gitleaks
Actions → Trivy Config Scan
Actions → OWASP ZAP DAST
Kyverno and Falco are deployed as part of the platform bootstrap/GitOps setup. Use the earlier testing steps ☝️ Falco and Kyverno
Step 4: Review DefectDojo
Dashboard → Products → Otel Labs
The configured scans feed their results into the relevant DefectDojo engagements.
Key Takeaways
| Layer | Tool | What it covers |
|---|---|---|
| Secrets | Gitleaks | Git history and current repository |
| SAST | Semgrep | Source-code security |
| Dependencies | Trivy FS | Application dependencies |
| Image | Trivy Image | Built container images |
| Infrastructure | Trivy Config | Terraform and Kubernetes configuration |
| Admission | Kyverno | Kubernetes policy enforcement |
| Runtime | Falco | Suspicious behavior in running workloads |
| DAST | OWASP ZAP | The deployed web application |
| Findings | DefectDojo | Centralized security findings |
Troubleshooting
Workflows Not Running
Check paths-ignore and the path filters in the workflow files. Some changes intentionally do not trigger every scan.
Gitleaks Too Noisy
Reduce false positives using the repository's Gitleaks configuration/ignore rules.
Kyverno Blocking Legitimate Pods
Use a scoped PolicyException for legitimate workloads rather than disabling the policy globally.
Next Steps
- Network policies — Restrict pod-to-pod communication.
- Vault — Use Hashicorp Vault for secret management.